


.png)
Let’s talk

Thank you! Your submission has been received!
Oops! Something went wrong while submitting the form.
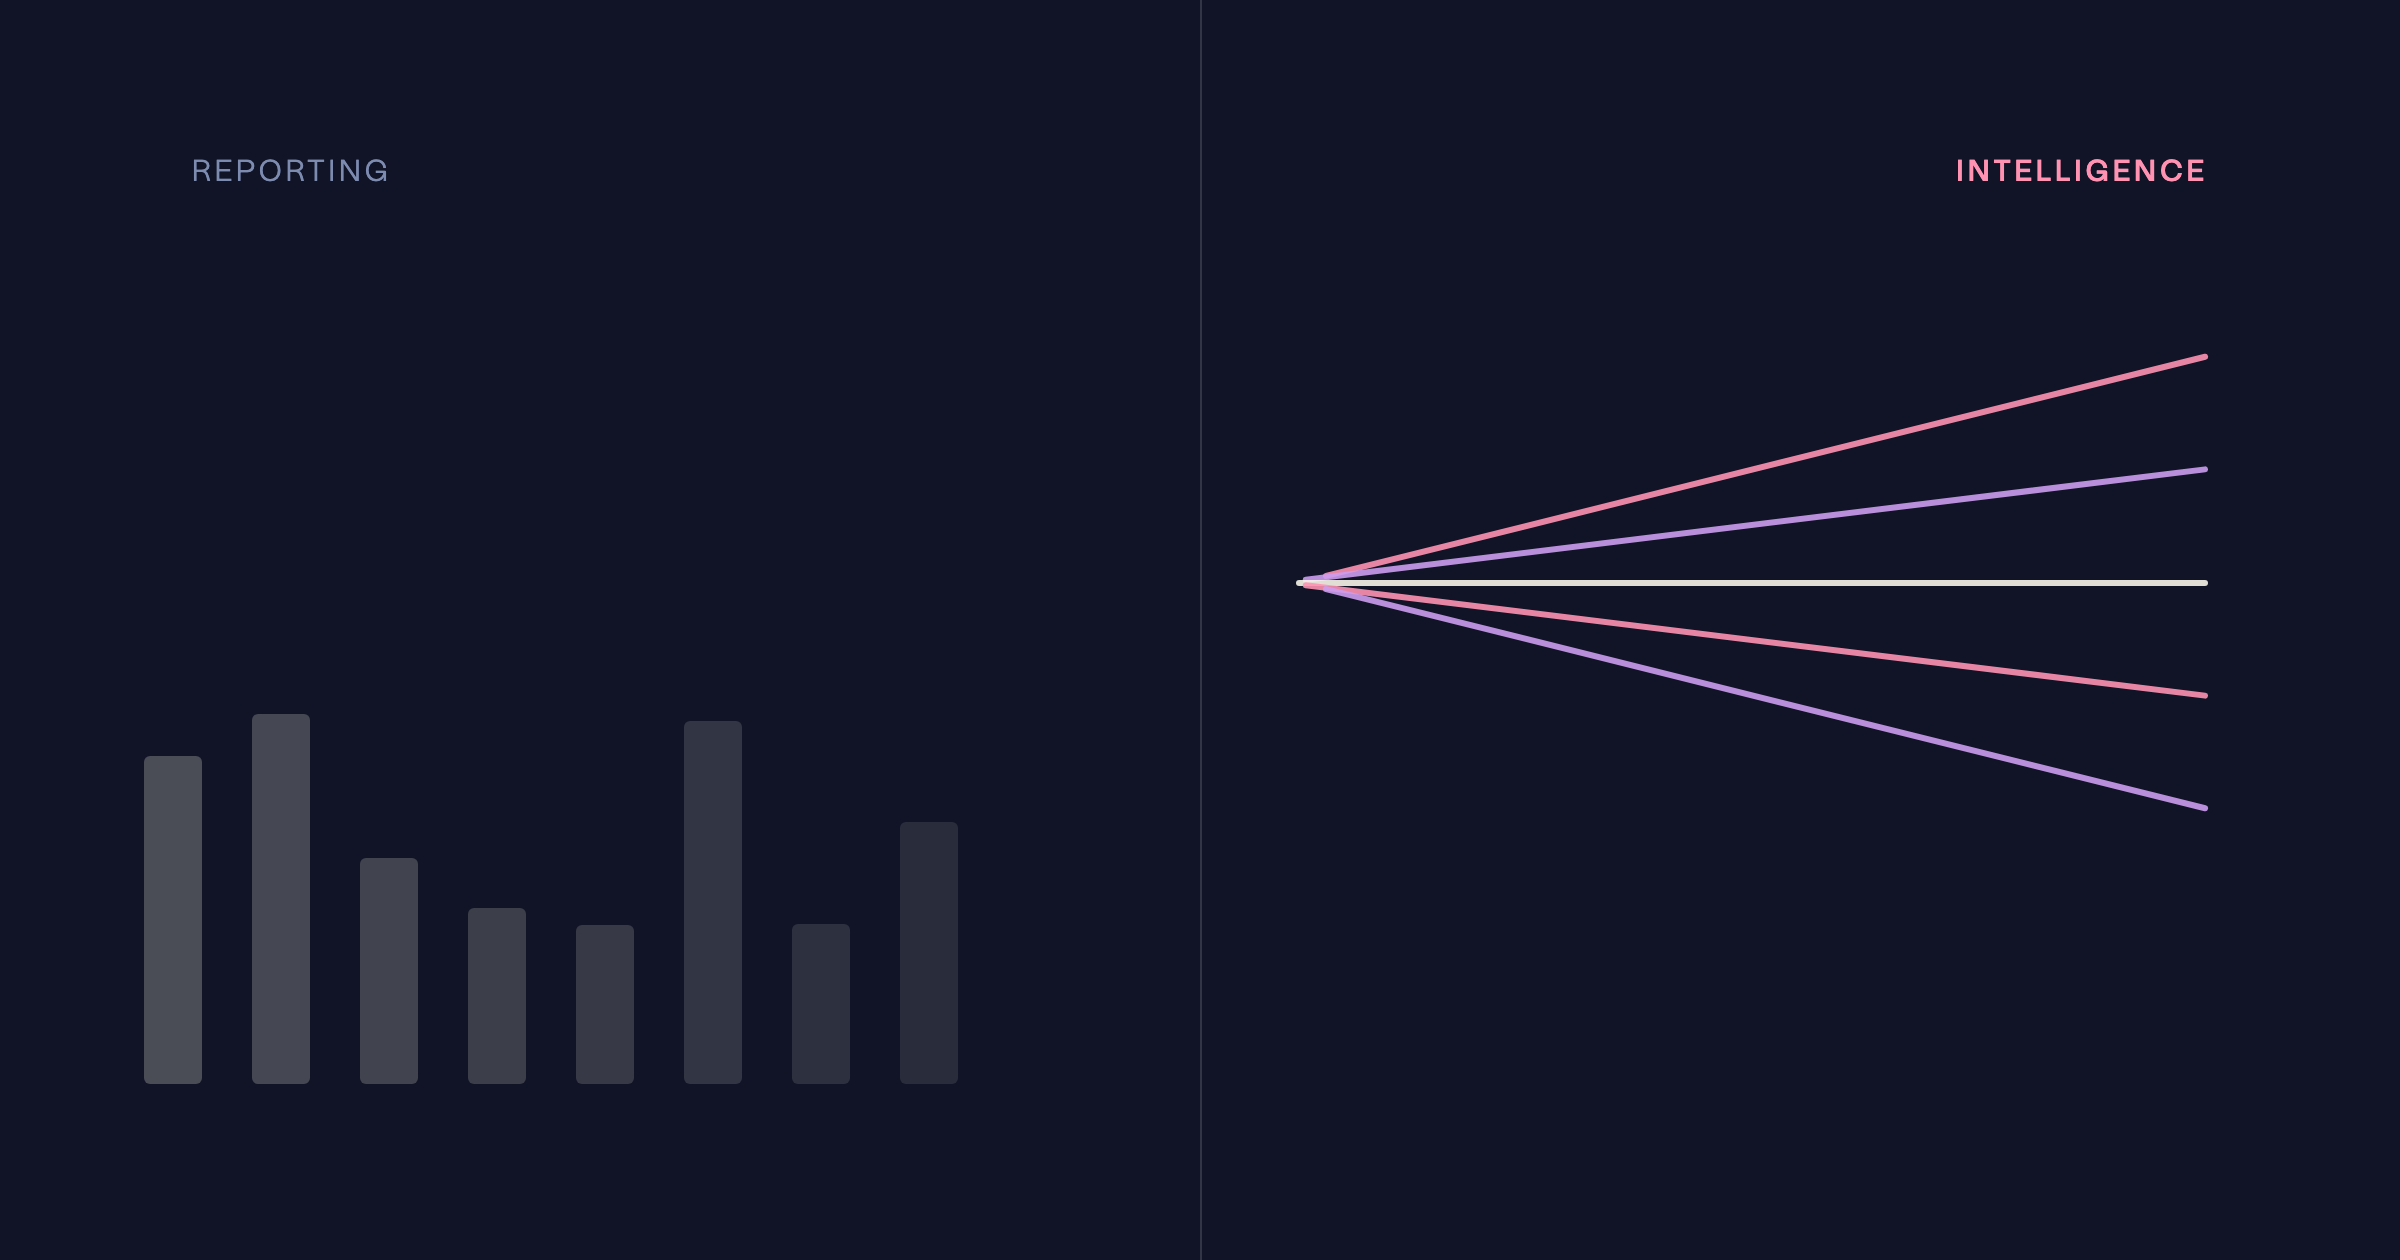
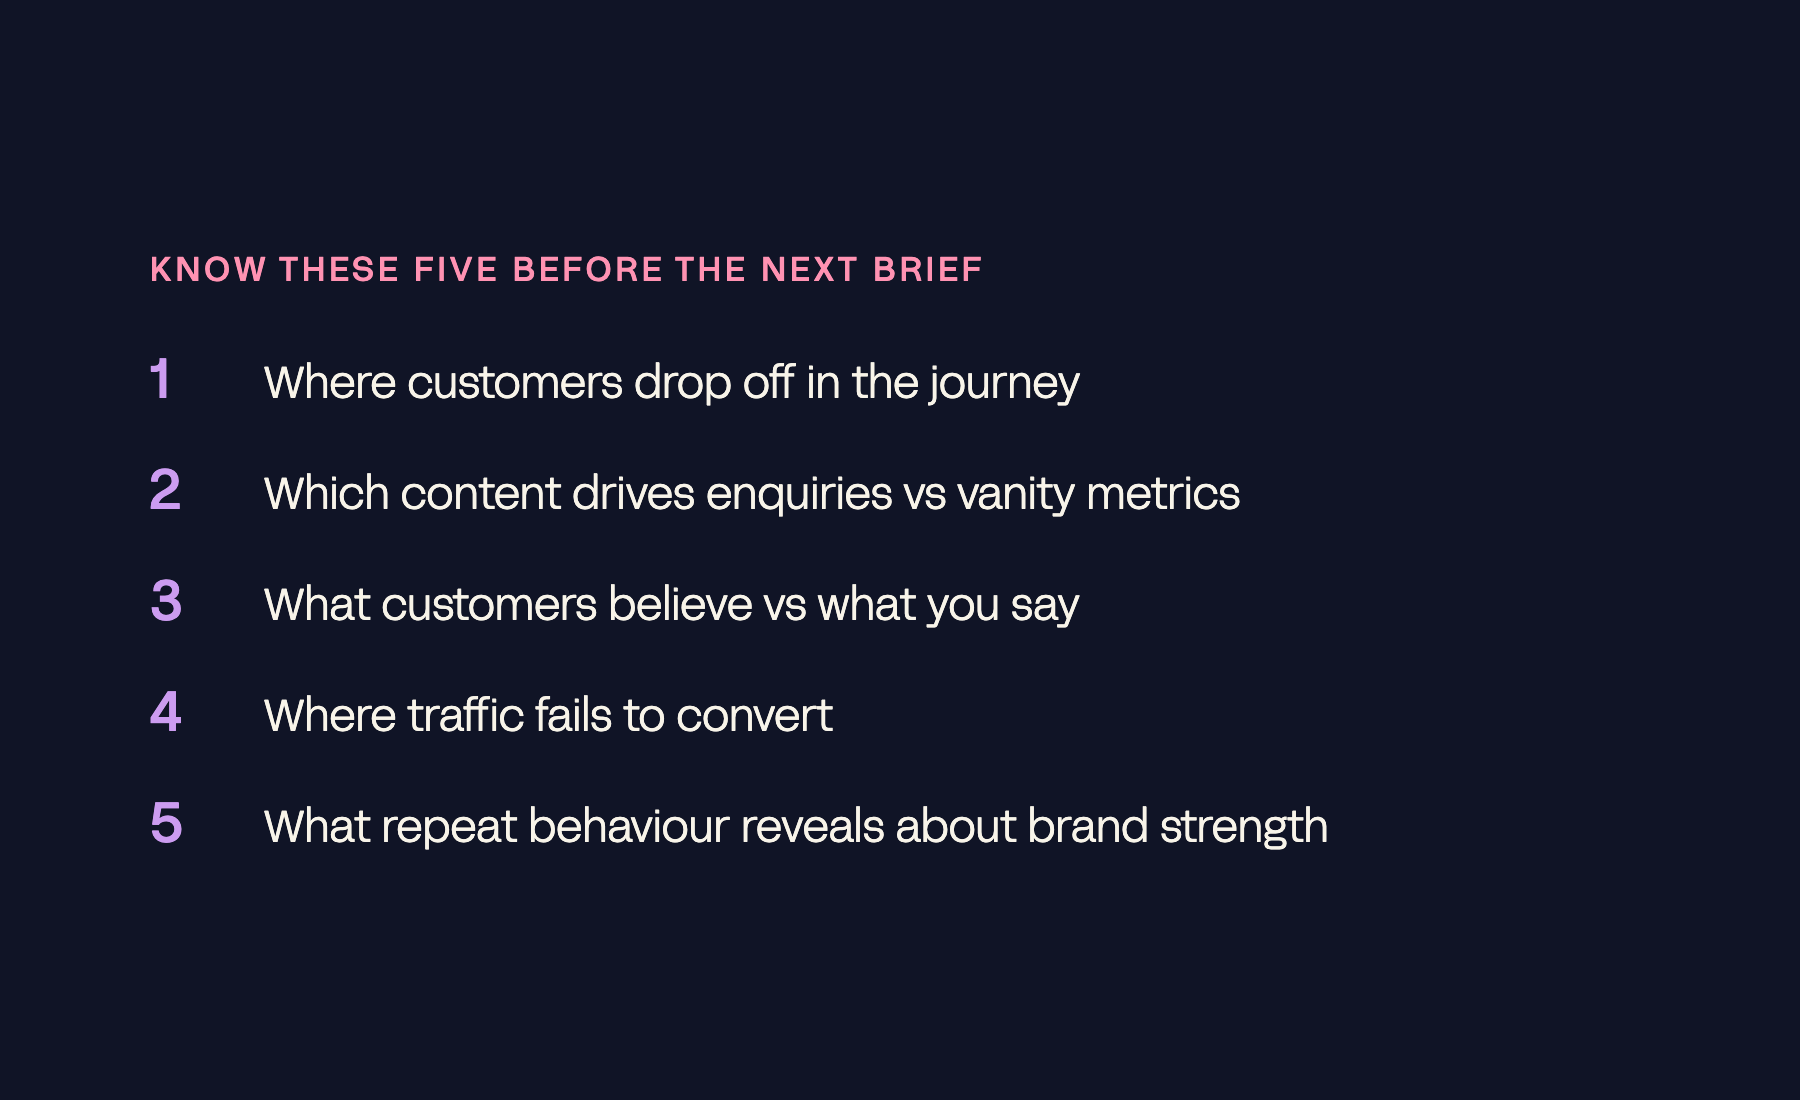
Data used after the fact is reporting; data used before the brief is intelligence. Know where customers drop off, which content drives enquiries, what customers actually believe about the brand, where traffic fails to convert, and what repeat behaviour says about brand strength – before the next project starts.
Most brands collect data after the campaign, after the launch, after the rebrand. They use it to justify what already happened. That is reporting, not intelligence. The cost: every brief starts from assumptions instead of evidence.
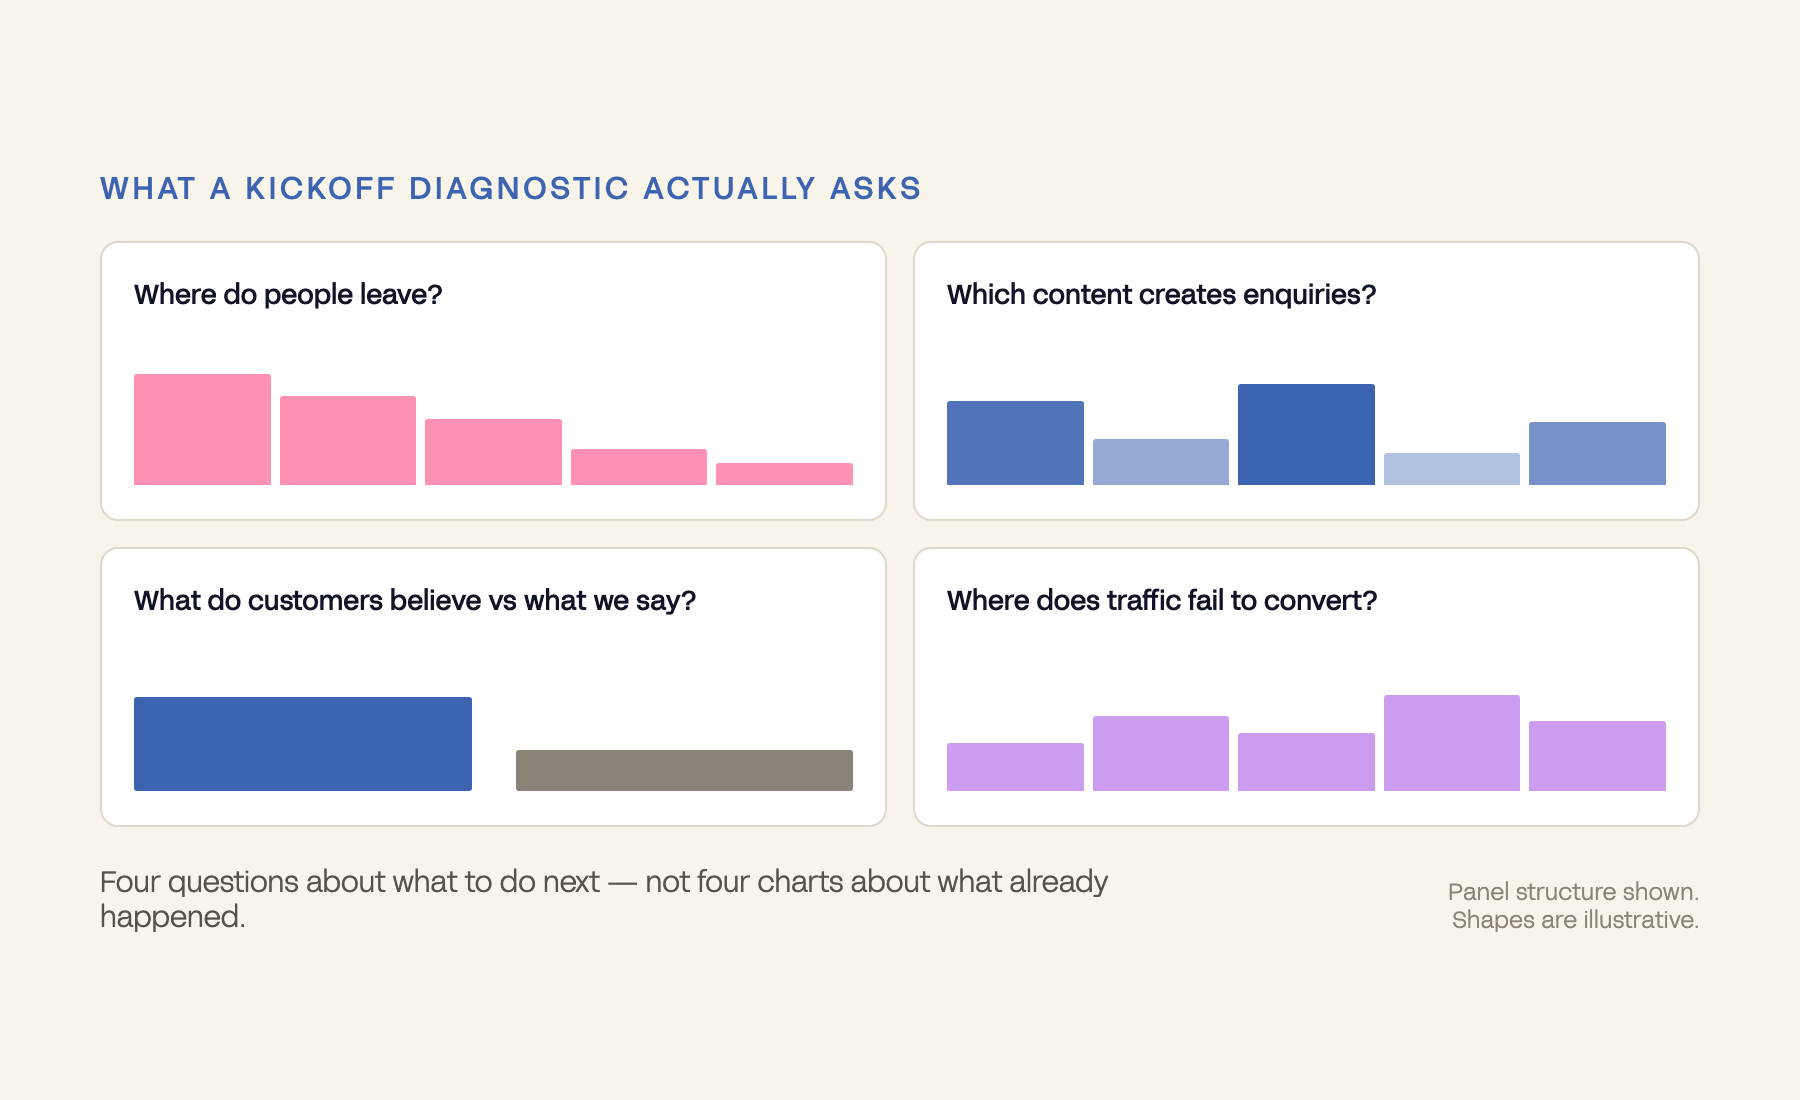
Data intelligence means using customer signals, behavioural patterns, conversion data, content performance, and market context to shape creative and strategic decisions before work begins. Knowing which product pages create belief and which create confusion. Understanding where the customer journey breaks before redesigning the website – not after.
The homepage, where attention drops off unnoticed. Product pages that list features instead of building desire. Content that never compounds. Email and lifecycle with no behavioural triggers. Launches that generate hype without nurture. And identity decisions driven by taste alone rather than how the market actually perceives the brand.
Data does not make creative work safe. It makes creative work precise.
– The Antimony position
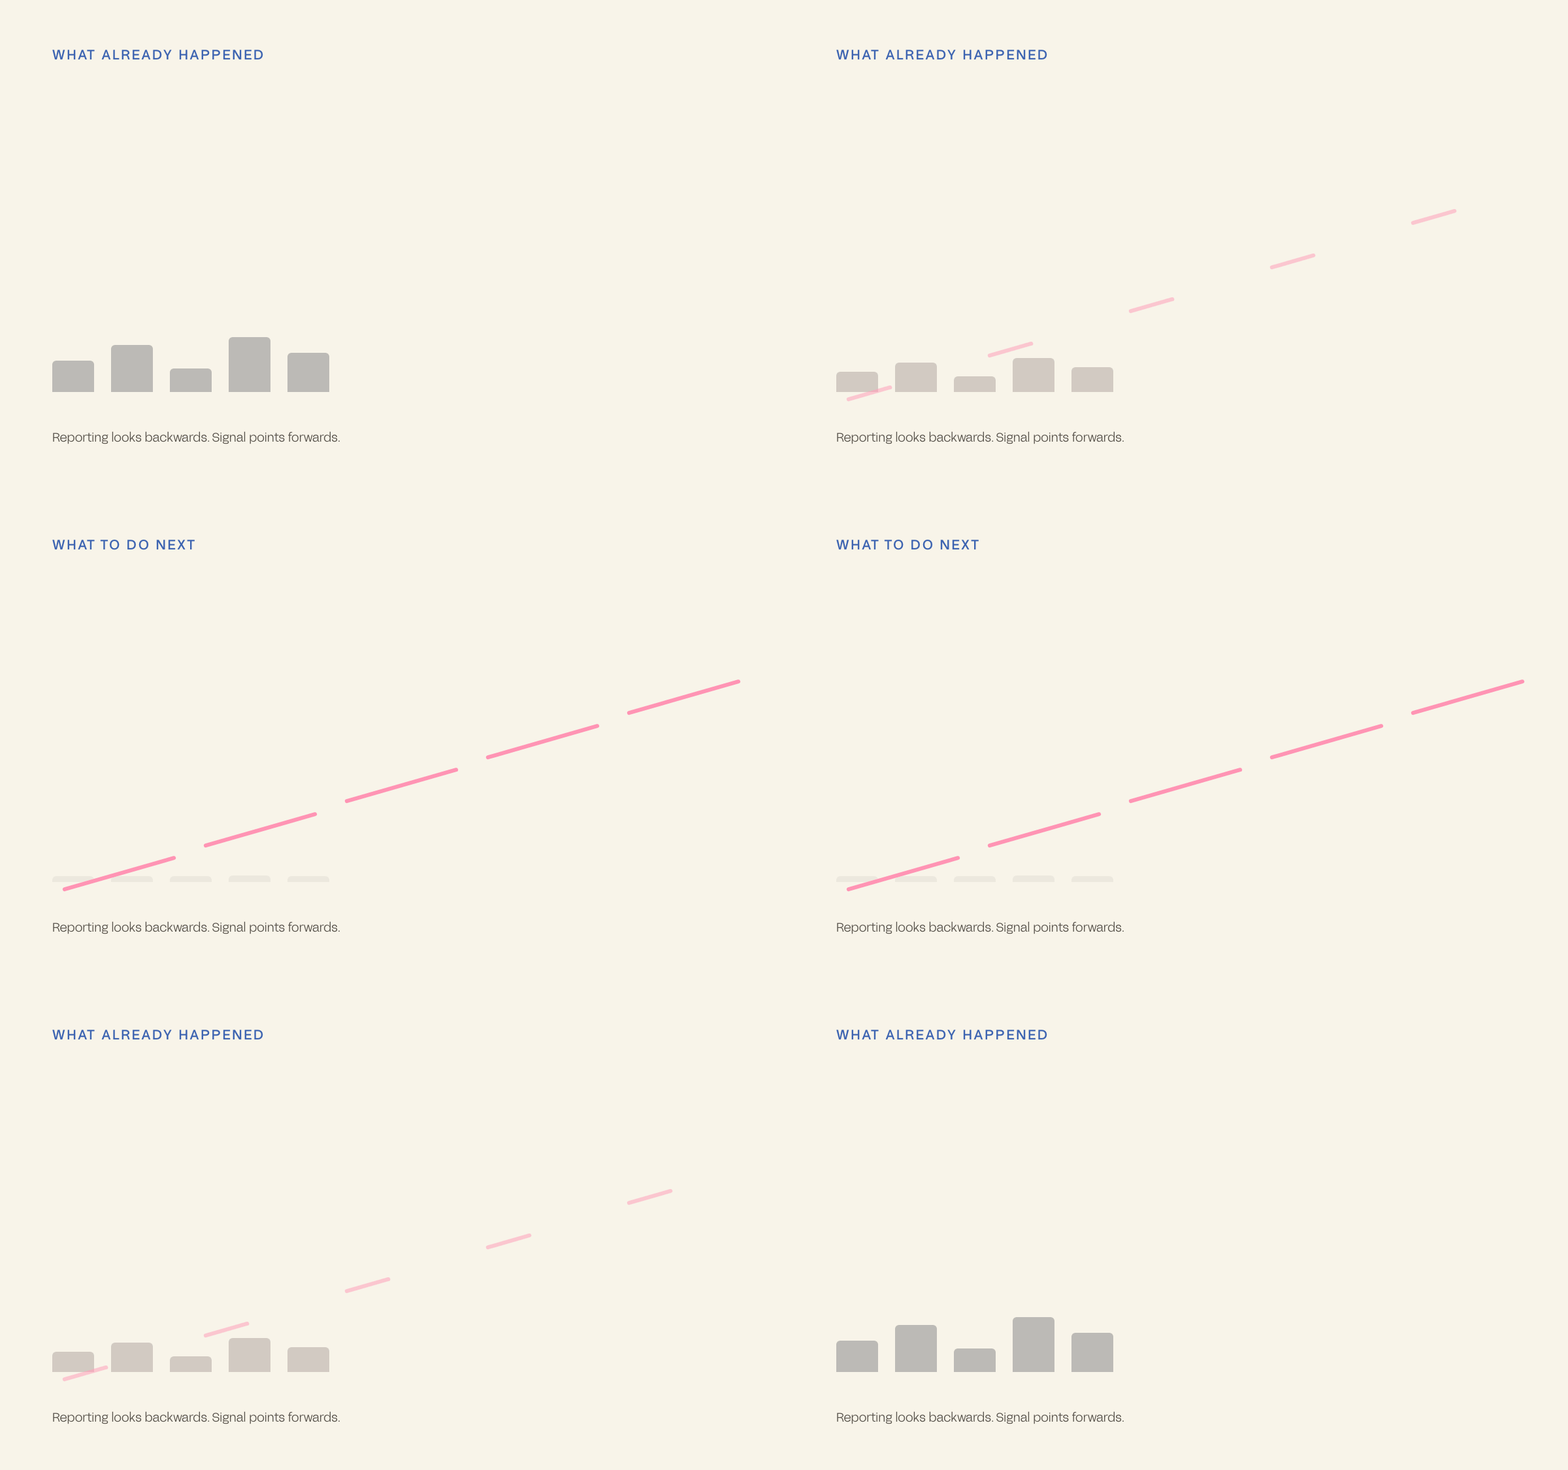
Data is not a separate analytics phase at Antimony – it is baked in from day one. It shapes the Brand Evolution Sprint, informs website architecture, sets content priorities, and times launch strategy. Before we rebuilt Obie's launch platform or repositioned 5th Element, the strategic decisions were grounded in evidence about the audience, the market, and the journey – then executed with creative conviction.
Future Isles is what data looks like when it runs forwards. Across three years embedded as the brand and growth team, the reporting was never the deliverable – it was the input. Every campaign told us something about who the buyer actually was, and the next campaign was built from that rather than from a fresh assumption.
The compounding shows up most clearly in the quality of what arrived, not the volume.
A backwards-looking report would have said the campaigns performed. The forward-looking read told us which buyer to build the next campaign for. Read the case study.
At single-listing scale the same discipline produced Taiharuru Cove: 6,938 website visits converted at 75% on the landing page into 209 qualified leads at $16.20 each, and a buyer pool spanning five countries.
The best brand systems are built on insight, not instinct alone. If your next project is starting from assumptions, start with a diagnostic instead.
Definitions. Vanity metric: a number that grows without changing commercial outcomes (impressions, likes). Behavioural trigger: an automated message fired by a customer action rather than a calendar.