


Let’s talk

Thank you! Your submission has been received!
Oops! Something went wrong while submitting the form.

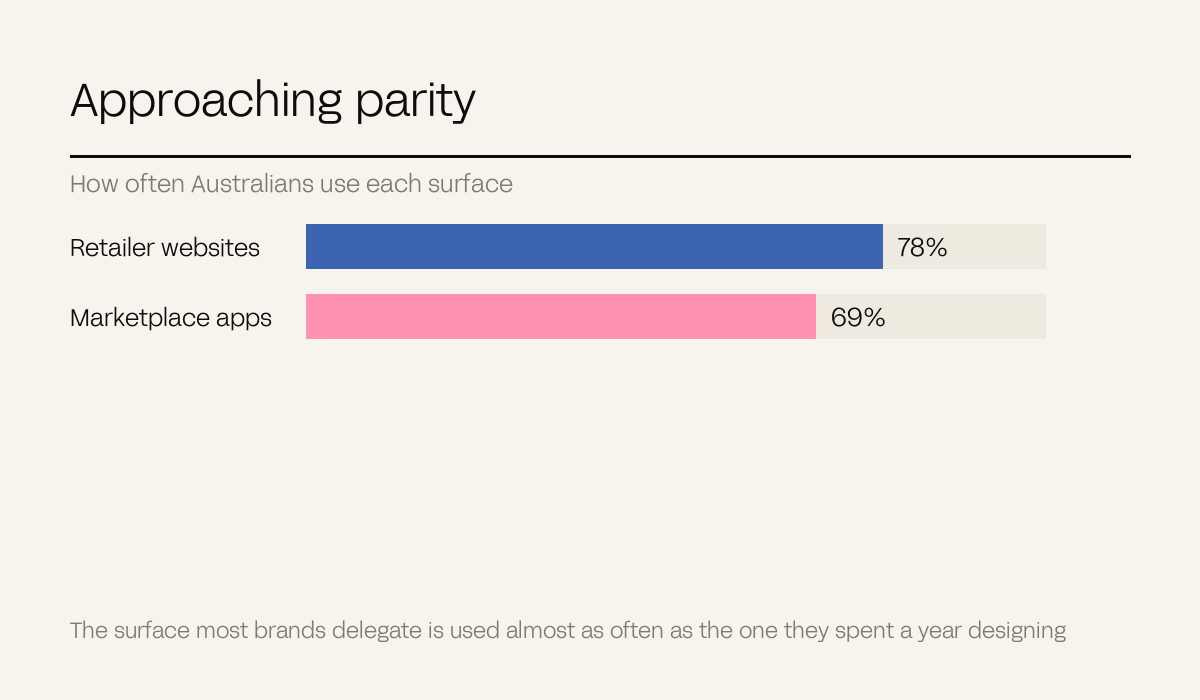
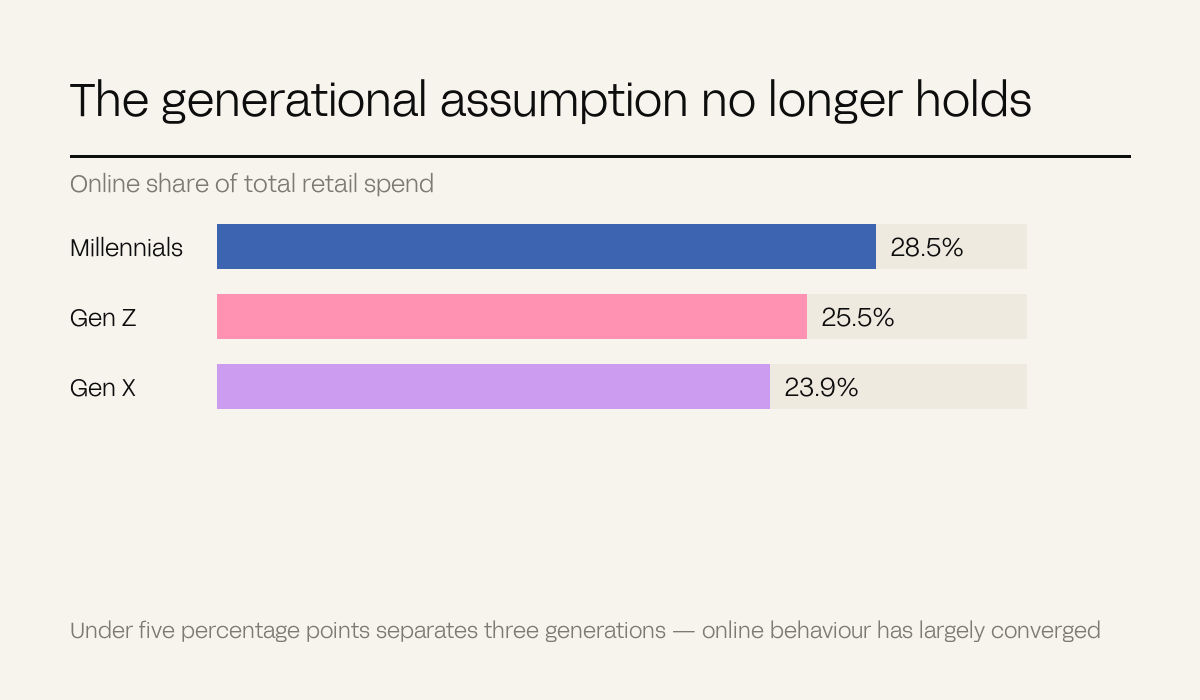
Australians spent $82.6 billion online in 2025, up 14% year on year, now 24% of all retail spending. Marketplace apps have reached 69% usage against retailer websites at 78%, and generational online share is converging – Millennials 28.5%, Gen Z 25.5%, Gen X 23.9%. The strategic reading is that the third-party surface is no longer secondary and the young-shopper assumption no longer holds.
The headline number gets quoted constantly. The three underneath it are the ones that should change what you do.
Australians spent $82.6 billion online in 2025, up 14% year on year, now representing 24% of all retail spend.
Useful as context, not as a strategy input. Nearly a quarter of retail being online tells you the channel is mature, not what to do next.
Marketplace apps are now at 69% usage against retailer websites at 78%.
That gap is small and closing. For most brands the marketplace listing is treated as a secondary channel run by whoever has time, while the website receives the design attention – and the data says those two surfaces are approaching parity in how often Australians actually use them.
The surface you delegate to whoever has a spare afternoon is now used almost as often as the one you spent a year designing.
– The Antimony position
Online share of total retail spend by generation: Millennials 28.5%, Gen Z 25.5%, Gen X 23.9%.
Three findings sit in that. Millennials, not Gen Z, allocate the highest share online. Gen X is within five points of the leader. And the spread across three generations is under five percentage points – meaning online behaviour has largely converged, and "our customers are older so digital matters less" is no longer defensible.
6 in 10 shoppers are comfortable using AI, and 32% are already using it for shopping advice.
A third of shoppers asking an assistant what to buy is a distribution question, not a marketing one – if the assistant does not know you, you are absent from that consideration set entirely. We cover the mechanics in The Entity Problem.
Audit the marketplace and delivery surfaces first, because they are the most under-designed high-usage assets most brands own. Welly Deli lifted Uber Eats order volume 48% and overall revenue 28% by designing that channel deliberately rather than uploading whatever photos existed.
Then check the stockist shelf, which is the physical version of the same problem. Ka Ka Wa designed every one of ten SKUs to tell the brand story at shelf across fifteen stockists, with revenue up 120% in year two.
They describe the market, not your category, and a national average conceals enormous variation. Our own property work is the clearest counter-example: Taiharuru Cove sold into a five-country buyer pool from 6,938 website visits – a tiny number that would look like failure against any national benchmark, converting at 75% because the audience was precisely defined.
The general rule: use market data to challenge your assumptions, not to set your targets. The moment a national average becomes a KPI, you start optimising toward the middle of a market you may have deliberately chosen not to serve.
Definitions. Online share of retail spend: proportion of a group's total retail spending transacted online.